


The production of cane, as well as its processing to obtain value-added products such as sugar, ethanol and electricity, among others, generate an environmental impact due to the use of inputs, fuel consumption, processing operations, etc., which they can be measured in terms of greenhouse gas emissions. Due to this, the estimation of the carbon footprint emerges as a tool to determine the environmental impact of a product, service or organization in terms of greenhouse gas (GHG) emissions, these are those gaseous components of the atmosphere, both natural as anthropogens, which absorb and re-emit infrared radiation (Macedo et al. 2008; Macedo et al. 2004).
Introduction
The production of cane, as well as its processing to obtain value-added products such as sugar, ethanol and electricity, among others, generate an environmental impact due to the use of inputs, fuel consumption, processing operations, etc., which they can be measured in terms of greenhouse gas emissions. Due to this, the estimation of the carbon footprint emerges as a tool to determine the environmental impact of a product, service or organization in terms of greenhouse gas (GHG) emissions, these are those gaseous components of the atmosphere, both natural as anthropogens, which absorb and re-emit infrared radiation (Macedo et al. 2008; Macedo et al. 2004).
By estimating the carbon footprint of anhydrous fuel alcohol production in Colombia, critical processes that require improvements or redesigns can be identified in order to reduce the environmental impact associated with the production of this biofuel (Hoefnagels et al. 2010; Alverson 2013).
Since 2012, Cenicaña developed the methodological bases for calculating the carbon footprint of sugar and ethanol production, with the aim of establishing the base line for GHG emissions in the Colombian sugar and alcohol sector and finding the critical points that most impact on these emissions. Using data from 4 mills in the region, the carbon footprint of the production of sugar, ethanol and electricity was estimated, defining as stages of the system the stages between planting the sugarcane and dispatching the products at the door of the factory (from the cradle to the door) (Palacios et al. 2015). GHG emissions were 22.3 kg CO2eq/ ton of cane when the only fuel used in the cogeneration plant is bagasse, the stages with the greatest contribution to total emissions were field and harvest (14 and 7 kg CO2eq/ ton of cane respectively), which includes land preparation, planting of cane, application of inputs, harvesting, transportation and delivery of cane to the factory (Palacios et al. 2015).
There are different methodologies for estimating the carbon footprint, including ISO 14064-1: 2006 "Greenhouse gases. Part 1: Specification with guidance, at the organization level, for the quantification and reporting of greenhouse gas emissions and removals ”and the technical specification ISO / TS 14067: 2013“ Greenhouse gases - Carbon footprint of products - Requirements and guidelines for quantification and communication ”. The first is focused on building the inventory of GHG emissions and removals at the organization level and the second is based on the sum of GHG emissions and removals in the life cycle of a product, based on an analysis of life cycle where the only impact category is that of climate change.
The continuous improvement in environmental terms of the production processes in the Colombian sugar and alcohol sector makes it necessary to establish the GHG emissions associated with each of the products, particularly the production of anhydrous ethanol fuel, since its final use aims to reduce the emissions of GHG in the transportation sector when mixed with gasoline and used as fuel in cargo and passenger vehicles (Nguyen & Gheewala 2008; Nguyen et al. 2010; Lisboa et al. 2011). Based on the procedure developed by Cenicaña to estimate the carbon footprint, this article presents the methodology for calculating emissions associated with the production of anhydrous ethanol.
Methodology
The carbon footprint of anhydrous fuel ethanol was calculated based on the inventory of GHG emissions from the stages of the production process of sugarcane, sugar, ethanol, bagasse and electrical energy, collecting the necessary information from designed forms. by Cenicaña and specifically addressed to each of them: field, harvest, raw sugar processing, energy management of the industrial process, fuel alcohol production and effluent treatment. Information was collected in terms of: use of inputs: fertilizers, insecticides, chemical process inputs, fuel consumption for transportation, machinery, energy generation, as well as consumption and generation of electrical energy.
Regulation
To calculate the GHG inventory, the methodology proposed in ISO 14064-1: 2006 was followed, which establishes the guidelines for calculating and reporting the GHG inventory of an organization. Currently this standard is certifiable by accredited verification bodies. These organizations are accredited by institutions that belong to the International Accreditation Forum (IAF) such as ANSI (American National Standards Institute) in the US or EMA (Mexican Accreditation Entity) in Mexico.
For each stage, emissions were calculated in the three scopes established in the standard, the following definitions are taken from ISO 14064-1: 2006:
Scope 1: Direct GHG emissions. Direct greenhouse gas emissions come from company-owned or controlled sources, for example, combustion emissions from boilers, ovens, vehicles, among others; emissions from chemical production in controlled process equipment or owned by the organization. Direct CO emissions2 from biomass combustion are not included in Scope 1.
Scope 2: Indirect GHG emissions from electricity. Scope 2 represents the GHG emissions from the generation of electricity purchased and consumed by the company. Electricity purchased is defined as electricity that is purchased or otherwise brought to the organizational limit of the business. Scope 2 emissions are physically produced in facilities where electricity is generated.
Scope 3: Other indirect GHG emissions. Scope 3 is a reporting category that allows for the treatment of all other indirect emissions. Scope 3 emissions are a consequence of the company's activities, but occur from sources not owned or controlled by the company. Some examples of Scope 3 activities are extraction and production of purchased materials; transportation of purchased fuels; and the use of products and services sold.
The following aspects are included within scope 3:
- Direct emissions due to change in land use.
- N emissions2Or the soil due to the use of nitrogen fertilizers.
- Indirect emissions from product use (associated with the production of inputs used in agricultural and manufacturing processes) and the transport of these to the plant.
- Consumption of fuel and electrical energy in agricultural work, which includes the work of preparing the land, irrigation, application of inputs in the field, harvesting and transporting the crop to the plant.
Emission Factors
The emission factors used for the combustion of fuels are reported in Table 1.
Table 1. Combustion emission factors used in the production of anhydrous ethanol
|
Combustion of: |
kgCO2/ TJ |
kgCH4/ TJ |
kgN2O / TJ |
Source |
|
Generic Coal |
88136 |
1 |
1.5 |
UPME - FECOC |
|
Bagasse |
0 |
30 |
4 |
UPME - FECOC |
|
Coffee husk |
0 |
30 |
4 |
UPME - FECOC |
|
Fuel oil |
78281 |
3 |
0.6 |
UPME - FECOC |
|
Commercial Diesel |
74832 |
1 |
0.6 |
UPME - FECOC |
FECOC: Colombian Fuel Emission Factors
Direct soil change was calculated taking into account the factors recommended by the IPCC (Intergovernmental Panel for Climate Change) and by the EU RED (Renewable Energy Directives of the European Union) (Muñoz et al. 2014). The factor used for soil emissions due to fertilization with nitrogenous compounds corresponds to that published by the IPCC as guidelines for the quantification of GHG emissions. It is considered that 1% of the nitrogen applied in the soil goes to the atmosphere in the form of N2Or due to denitrification (0.01 kgN_N2O / kg Napplied) (IPCC, 2006). For indirect emissions due to the use of products, recognized databases such as Ecoinvent and Agrifootprint were used.
Organization limits
The GHG inventory was carried out for the six fuel anhydrous ethanol producing mills installed in Colombia, with information for 2010; and it was calculated using the Simapro 8 software, specialized in life cycle analysis, which has the databases mentioned above. The limits established for the inventory calculation include the following stages of the process:
Field: Includes the process of planting the cane until before harvest, including the tasks of preparing the land, irrigation and application of inputs (fertilizers, insecticides, etc.)
Harvest: Includes the process of harvesting, transporting and delivering the cane to the factory.
Sugar factory: Includes the processes related to the preparation and transformation of sugar cane to obtain sugar, bagasse and materials with fermentable sugars (juices, syrups and honeys) required for the production of fuel alcohol.
Distillery: Includes the production process of fuel ethanol from the preparation of raw material (from the manufacturing process) to the dispatch of fuel ethanol, including: fermentation, distillation and dehydration.
Energy management of the industrial process: Includes the processes necessary to satisfy the electrical and thermal energy requirements of the industrial production of anhydrous alcohol (manufacturing process and distillery). It includes the cogeneration plant, which includes the combustion of the fuel used for the generation of steam in the boilers and its subsequent use in the turbogenerators for the production of electrical energy and / or the purchase or acquisition of thermal and electrical energy from an external source. .
Effluent treatment: Includes the wastewater treatment plants and the composting plant where the stabilized organic fertilizer is produced and applied in the field as a soil improver.
The stages can be seen graphically in Figure 1, Figure 2 and Figure 3.
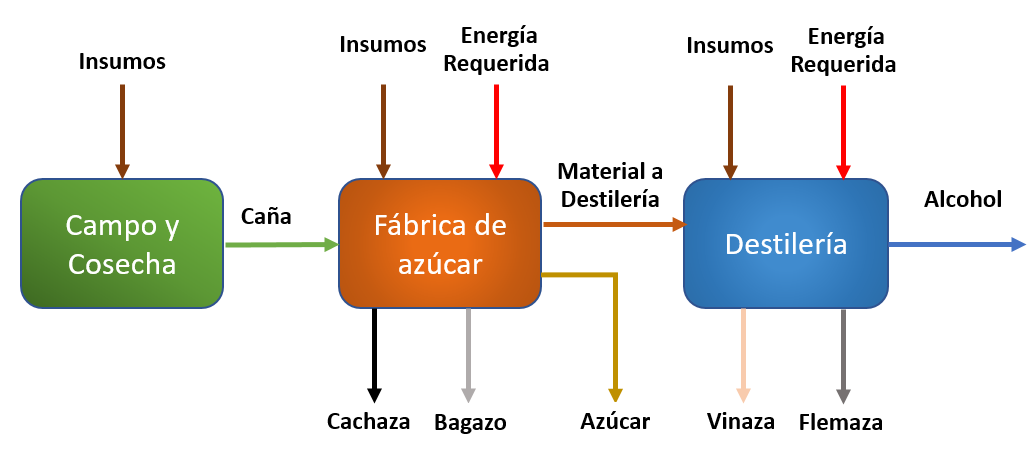
Figure 1. Stages of field, harvest, sugar factory and distillery for the production of fuel ethanol.
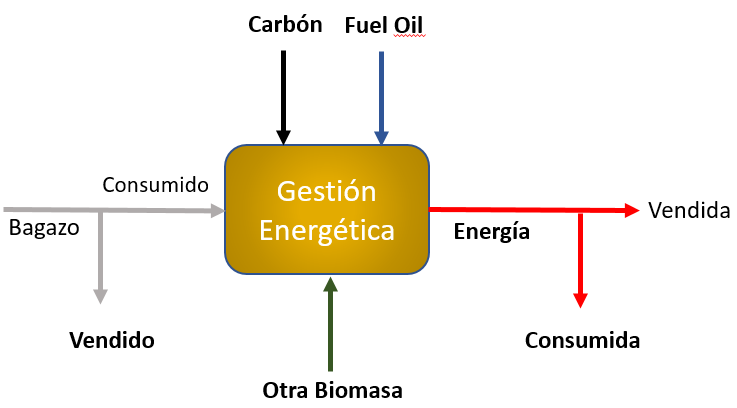
Figure 2. Energy management in the process of production of anhydrous ethanol from sugar cane
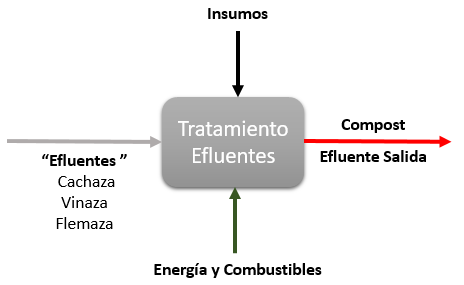
Figure 3. Effluent treatment in the production of fuel ethanol
Allocation of emissions and calculation of the specific indicator
In the case of the production of ethanol from sugarcane, sugar, ethanol, bagasse sold and electrical energy sold are considered as marketable products. If another type of raw material is used for the production of ethanol (corn, sorghum, beets, etc.), those products that have a market value should be considered as products. In the case of the production of ethanol from sugar cane, the products taken into account share the processes of field, harvest and manufacture of raw sugar; Since the unitary processes for each of the products cannot be separated in the mentioned stages, it is necessary to assign the emissions, so the inputs and outputs of the system must be separated between the different products, in such a way that they reflect the physical relationships between them. One way to make such a differentiation is by assigning factors to each product based on physical causal relationships, a physical property (mass or energy value), or its economic value (Klöpffer 2005).
The physical allocation method works well when there is a close correlation between the chosen physical property and the value of the co-products. In the case of the allocation of mass (weight) one of its limitations is that it cannot be applied to energy services, such as, for example, the production of a cogeneration plant. The energy allocation better reflects the causal relationship between the products generated (sugar, bagasse, ethanol and electricity). In relation to the economic allocation (or the market value), it presents drawbacks as it is influenced by the high variability and distortion in the markets, which does not make it applicable in all cases (Wang 2014; Khatiwada et al. 2012).
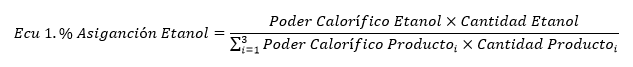
The selected criterion based on the reasons given was that of energy distribution among the products. The allocation was made taking into account the energy contained in each of them, that is, the result of the multiplication of the calorific value and the quantity of the product produced in the established period of time. The allocation percentage in the processes for fuel anhydrous ethanol is calculated as follows:
|
Co-product |
Calorific value (MJ / kg) |
Source |
|
Sugar |
16.7 |
ROYAL DECREE 2267/2004 Table 1.4 |
|
Ethanol |
25.1 |
ROYAL DECREE 2267/2004 Table 1.4 |
|
Bagasse (50% Humidity) |
8.84 |
Queen (2007) |
|
Electricity |
— |
— |
The emissions inventory associated with anhydrous fuel ethanol in the energy management of the industrial process is calculated from the specific energy requirements for each product, taking into account the bagasse used in the boiler available for each product. To establish this inventory, the energy generated in the cogeneration plant was calculated from the combustion of bagasse, and ethanol was assigned a quantity of this energy, proportional to its energy distribution.
The energy requirements for each product were calculated, for ethanol a part proportional to the energy distribution of the requirement in the raw sugar factory and 100% of the requirement in the distillery was considered. It was verified that the energy available from the bagasse covered these energy requirements, if this energy is sufficient, the emissions of scope 1 in the energy management of industrial processing are those due to the combustion of the biomass used to cover them. If not covered, the emissions from industrial processing energy management are the sum of the emissions due to the production of energy from bagasse assigned to ethanol and the emissions due to the production of energy from the additional fuels used. Scope 3 emissions at this stage are assigned proportional to the energy distribution of ethanol.
From the total inventories of each stage, the carbon footprint corresponding to the production of anhydrous fuel ethanol for each of the mills was calculated. Emissions from each stage were assigned to fuel anhydrous ethanol as shown in Table 3.
Table 3. Allocation of emissions inventory for fuel anhydrous ethanol
|
Stage |
Emissions Inventory for Anhydrous Ethanol |
|
Field |
% Ethanol Allocation * Total emissions |
|
Harvest |
% Ethanol Allocation * Total emissions |
|
Sugar Factory |
% Ethanol Allocation * Total emissions |
|
Distillery |
100% * Total emissions |
|
Energy management of the industrial process |
Specific energy consumption |
|
Effluent treatment |
% Ethanol Allocation * Total emissions |
|
Total |
Sum of all stages |
Taking as a functional unit the production of one cubic meter of anhydrous fuel ethanol and starting from the total emission inventory for this product, the specific emissions for the functional unit are calculated; that is, the total emissions are divided by the cubic meters produced in the established period of time. GHG emissions are expressed in kilograms of carbon dioxide equivalent per cubic meter of ethanol (kg CO2eq/m3 ethanol), which converts emissions of other greenhouse gases other than CO2 in kilograms of CO2 based on its ability to affect climate change. For example, methane (CH4) is 30.5 times more harmful than CO2 and nitrous oxide (N2O) 265 times (IPCC 2013).
Result
The emissions inventory was calculated individually for each fuel anhydrous ethanol production plant, with consolidated information for 2010. Figure 1 shows the average emissions of the 5 plants that were operating in 2010 in terms of kg CO2eq / m3 fuel anhydrous ethanol produced, error bars represent standard deviation for each year.
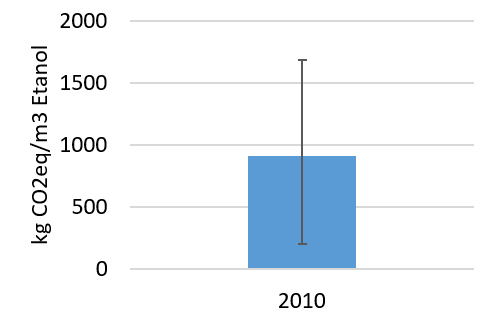
Figure 4. Average and standard deviation of specific GHG emissions for anhydrous fuel ethanol production in Colombia in 2010.
The energy distribution between the four products (ethanol, sugar, bagasse sold and electrical energy sold) was calculated individually for each mill; the average distribution was 22%, 61%, 15% and 2% for ethanol, sugar, bagasse sold and electric energy sold respectively. Table 4 shows the average GHG emissions per cubic meter of ethanol produced for each of the stages of the process. It is highlighted that the contribution of the energy management of the industrial process is the highest, this is because some of the plants use coal as additional fuel to complete the energy requirement of the ethanol production process.
Table 4. Average GHG emissions per cubic meter of ethanol in each of the stages of the process.
|
Stage |
2010 GHG emissions (kg CO2eq/m3 Ethanol) |
|
Field |
92 |
|
Harvest |
60 |
|
Sugar Factory |
12 |
|
Distillery |
22 |
|
Energy management |
672 |
|
Effluent treatment |
51 |
|
Total |
909 |
The high standard deviation observed in the GHG emissions inventory of 651 kg CO2eq / m3It is due, among other reasons, to the technological and operational differences in the agricultural and production processes of the 5 fuel alcohol production plants. The greatest variation is found in the energy management of the industrial process, where some mills due to the characteristics of the boilers and the turbogenerators require additional fuel to the bagasse, such as fuel oil or coal, the latter being the largest source of emission of GHG.
Denaturation and transport to the point of wholesale supply
The denaturation process consists of adding a percentage of gasoline (2%) to the anhydrous ethanol fuel in the distillery prior to its distribution. Denatured anhydrous fuel ethanol is composed of 2% gasoline and 98% fuel anhydrous ethanol, hence the emissions associated with 1 m3 of denatured anhydrous fuel ethanol are those corresponding to the emissions from the production of 980 L of fuel anhydrous ethanol and the emissions from the production of 20L of gasoline (0.452 kg CO2eq / L).
To estimate the emissions associated with the distribution of ethanol, the average of the distances traveled from the distilleries to these wholesale supply centers where the mixture is made with gasoline for distribution at service stations was considered. The average distance traveled to transport ethanol to wholesale supply centers is 493 km.
Emissions due to transport were calculated using the emission factor associated with freight transport present in the Ecoinvent database [Transport, lorry> 28t, fleet average] which corresponds to 0.1081 kg CO2eq/km.m3 denatured fuel anhydrous ethanol.
These emissions on average are equivalent to 53 kg CO2eq / m3 ethanol respectively. By adding this value to the emissions reported in Table 4, the result is 962 kg CO2eq / m3 ethanol for 2010.
Conclusions
- A methodology was established for the estimation of the carbon footprint in the production of fuel ethanol based on the ISO-14064-1: 2006 standard.
- Using energy distribution as allocation criterion and having kg CO as functional unit2 equivalent / m3 of ethanol, it was established that the average carbon footprint for fuel anhydrous ethanol produced in the 5 Colombian distilleries was 902 kg CO2eq / m3 Ethanol in 2010, considering how the system limits from the sowing of sugar cane to the distribution to the wholesale supply centers.
Bibliography
Alverson, R., 2013. Rethinking the Carbon Reduction Value of Corn Ethanol Fuel. Ethanol Across America.
Hoefnagels, R., Smeets, E. & Faaij, A., 2010. Greenhouse gas footprints of different biofuel production systems. Renewable and Sustainable Energy Reviews, 14 (7), pp. 1661-1694.
IPCC (Intergovernmental Panel for Climate Change) 2006, Guidelines for National Inventories of Greenhouse Gas Emissions, http://www.ipcc-nggip.iges.or.jp/public/2006gl/vol4.html
Khatiwada, D. et al., 2012. Accounting greenhouse gas emissions in the lifecycle of Brazilian sugarcane bioethanol: Methodological references in European and American regulations. Energy policy, 47, pp. 384–397.
Klöpffer, W., 2005. Life Cycle Assessment as Part of Sustainability Assessment for Chemicals (5 pp). Environmental Science and Pollution Research, 12 (3), pp. 173-177.
Lisboa, CC et al., 2011. Bioethanol production from sugarcane and emissions of greenhouse gases - known and unknowns. GCB Bioenergy, 3 (4), pp. 277-292.
Macedo, IC, Seabra, JE a & Silva, JE a R., 2008. Green house gases emissions in the production and use of ethanol from sugarcane in Brazil: The 2005/2006 averages and a prediction for 2020. Biomass and Bioenergy, 32 (7), pp. 582-595.
Macedo, IDC, Leal, MRLV & Silva, JEAR Da, 2004. Assessment of greenhouse gas emissions in the production and use of fuel ethanol in Brazil. , (March), p.37.
Muñoz, I. et al., 2014. Life cycle assessment of bio-based ethanol produced from different agricultural feedstocks. International Journal of Life Cycle Assessment, 19 (1), pp. 109-119.
Nguyen, TLT & Gheewala, SH, 2008. Fuel ethanol from cane molasses in Thailand: Environmental and cost performance. Energy policy, 36 (5), pp. 1589-1599.
Nguyen, TLT, Gheewala, SH & Sagisaka, M., 2010. Greenhouse gas savings potential of sugar cane bio-energy systems. Journal of Cleaning Production, 18 (5), pp. 412-418.
Palacios García, D. et al., 2015. Analysis of the life cycle of the Colombian sugar sector as a tool to determine its greenhouse gas emissions. X Technician 2015.
Royal Decree ROYAL DECREE 2267/2004, of December 3, which approves the Regulation of fire safety in industrial establishments. BOE nº 303 17-11-2004; http://www.insht.es/InshtWeb/Contenidos/Normativa/TextosLegales/RD/2004/2267_04/Ficheros/tabla1_4.pdf
Rein, P., 2007. Cane Sugar Engineering. Berlin: Verlag Dr. Albert Bartens KG.
Wang, M., 2014. Life-Cycle Greenhouse Gas Emissions of Corn Ethanol with the GREET Model GREET includes more than 100 fuel production pathways from various energy feedstock sources.
Note
Updated version of the methodology for calculating the carbon footprint of fuel anhydrous ethanol with the following changes: it includes the wastewater treatment plants, the stabilized organic fertilizer production plant (composting) and adds electrical energy as a by-product.
 Save as PDF